CAPLAN
CAPLAN (Cremer's Survey Processing and Plan Design) caters for all tasks encountered in surveying and civil engineering, for example if you need to
- carry out surveys using total stations and/or GNSS technology,
- create inventory and quantity plans,
- construct digital terrain models (DTMs),
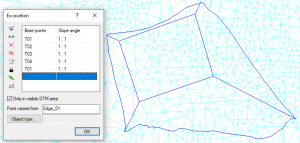
- create an excavated pit and determine its volume,
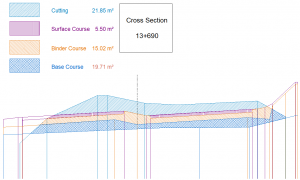
- verify road construction volumes using cross-sections,
- set out a road surface,
- carry out special engineering tasks,
- process tacheometric (total station) observations and leveling observations,
- determine the breakthrough accuracy when tunneling,
- adjust networks with the highest level of precision
The program also offers interfaces to all common data transfer formats.
The CAPLAN module provides an optimized project database sub-module, which can be used to carry out all manner of processing and calculations, and a plan output sub-module, which can be used to create plans, maps and (cross and longitudinal) sections. This basic module can be supplemented with individual additional modules so that CAPLAN is perfectly tailored to your particular surveying tasks. We offer the following modules:
CAPLAN – Project Database and Plan Creation
The project database usually contains points and lines, and can also be used to save and process alignments, sections (profiles), observations and 3D objects. Complex objects, such as networks and DTMs, can also be handled in the project database. A project is displayed in three windows: a point directory, an overview and a 2D detail window. Other views (e.g. for longitudinal sections, cross sections etc.) are available in the plan window.
The lines always pass through existing points and are therefore included in any shift or transformation of the points. As points can be given an elevation, these Z-coordinates can also be used by the lines. Points and lines form the basis for individually configured inventory plans.
Technical details:
- Point names can be up to 16 characters long and the points can also have an object type (code) and up to 50 attributes
- Lines with arcs
- Object types can be alphanumeric and of any length
- Support for numerous point and line formats, such as manufacturer-specific total station formats, CSV, DXF, LandXML, NAS, OKSTRA, Google Earth KML, user-defined, etc.
- Exchanging of points with Excel via the Clipboard
- Several methods for recording line strings using field observations
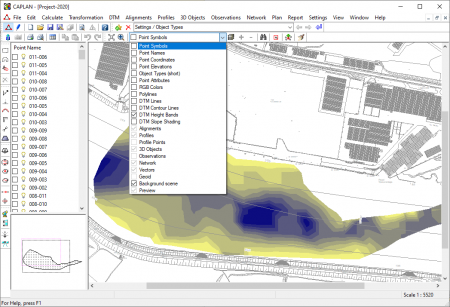
- View Controller that allows flexible displaying of layers and object types
- Comprehensive tools for processing points
- Entry via table (national grid coordinates or geographic)
- Entry via reference line
- Selection based on name, object type, attributes, significance
- Selection based on geometry (rectangle, polygon, corridor)
- Renaming using a table
- Object type changes via a table
- Shift, rotate, transform (using two points) coordinates
- Comprehensive tools for processing lines
- Construction using relative coordinates, tangential arcs
- Interpolation of elevations for intermediate points
- Reduce, explode, join
- Approximation of arcs using intermediate points
- Parallels
- Rounding of two lines with an arc
- Trim / extend lines
- Profile plan along a line
- Fundamental calculations
- Bearing and distance
- Offsets from a reference line
- Length of and area enclosed by lines
- Intersection points
- Define rectangle using three points
- Reduction or correction of dimensions e.g. for UTM
- Epoch comparison e.g. for settlement measurements
- Undo and redo for all processing steps
- Comprehensive documentation in CAPLAN.LST
- Flexible configuration of reports
The data management and design options in the plan window provide everything that is required of a standard CAD system used for surveying purposes. This includes a universal layer structure for all the drawing elements as well as freely definable symbols, which can also be imported from DXF files.
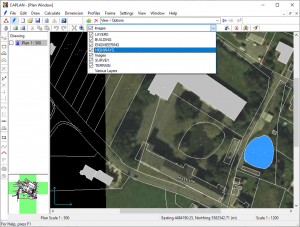
A plan is usually the visible document that results from a surveying assignment. While the project only uses standardized representations of features, switching to the plan sub-module and the plan design allows virtually everything the user could want in terms of display capabilities, including freely-definable text additions with automated reference lines, as well as the hatching of buildings and slopes and the filling of areas. Existing planning documents, orthophotos, satellite imagery, and Web Map Services (WMS) can also be used to provide a georeferenced background.
Useful design functions together with snapping options allow rapid completion of plans. A range of dimensioning functions enables numeric embellishment of plan data, with correction of the dimensions to the observation horizon, based on the defined coordinate system, being possible.
When outputting plans, they can be furnished with a DIN/ISO compliant frame, a title box and other details such as a legend and a coordinate grid. All plans can be output to printers, plotters and PDF files.
Technical details:
- Drawing elements structured using layers
- Layer structure freely configurable based on object types
- Plan creation involving symbols, point labels and lines
- Symbols, lines, areas, text, images, Web Map Services (WMS)
- Text with automated reference lines
- Images with georeferencing that can be saved
- WMS can also be used offline
- Point snapping for precision
- Conversion of lines to an area, and vice versa
- Slope shading
- Design functions
- Label symbols with attributes
- Scale and rotate symbols and text
- Move and rotate elements
- Lines defined by relative coordinates, tangential arcs
- Approximation of lines using splines
- Explode / join lines
- Parallel lines
- Trim / extend lines
- Define rectangle using three points
- Creation of intersection points
- Area perimeters from any boundaries
- Line-accompanying symbols
- Dimensioning (2D/3D)
- Correction of dimensions to the observation horizon
- Distances
- Orthogonal
- Line lengths
- Line gradients
- Line angles
- Areas
- Contour lines
- Automatic legends from projects
- Point list
- Symbols, line patterns, area fillings
- Height bands
- Slope shading
- Plan area management
- Customization of plan frames (with field functions)
- Creation of plan frames
- Plan frames based on multiple plan areas
- Plan frames with detail views and overview
- Import and export of DXF data
- Symbol library expandable from DXF
- Import and export of OKSTRA data
- Import of cadastral data in the NAS format
INDIGO – Digital Terrain Models (DTM)
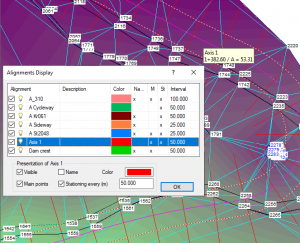
Digital terrain models (DTMs) allow the calculation of various route planning options without the need to collect additional data. CAPLAN can process data regardless of whether it has been collected terrestrially (with a total station or GNSS), by boat (using echo sounding) or from the air (using photogrammetry or airborne laser scanning).
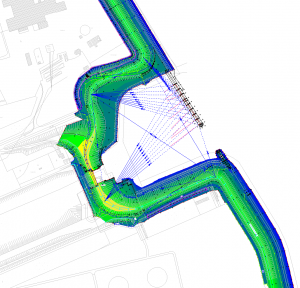
Up to several hundred thousand points can quickly be meshed to form a network of triangles (TIN), and the program’s special viewing functions (contours, height bands and slope shading) can be used to easily identify potential data errors. The local editing functions allow errors to be corrected in just seconds, and the amended output is displayed immediately. An even more detailed visual inspection is provided by the spatial representation of DTMs in the VIS-All® software developed by our partner company Software-Service John GmbH (www.john-software.de). DTMs can be intersected to calculate cut and fill volumes (calculated using prisms based on the REB VB 22.013 method). These can be displayed graphically in a difference model, which not only provides a clear visual illustration but also allows accurate and transparent verification.
Technical details:
- Triangulated meshes (TIN) with multiple outer borders, exclusion areas and break lines
- Use of existing lines as outer borders, exclusion areas and break lines
- Automatic indentation of outer border or indentation using crossing lines
- All processing steps displayed immediately
- Support for DA 58, OKSTRA, LandXML, DXF, Trimble TTM and Topcon TP3 formats
- Transfer to machine control systems
- Merging of two terrain models
- Contour lines, colored height bands and slope shading
- 3D visualization in VIS-All®
- Elevation of lines to DTM
- Interpolation of freely-defined sections through multiple DTM horizons
- Interpolation of longitudinal and cross sections through multiple DTM horizons
- Elevation interpolation in the grid and for individual points
- Elevation difference between points and a DTM
- Designing of excavations, deposits, terraces or slopes
- Calculation of 3D areas
- Volume calculations between two DTMs (pursuant to REB VB 22.013), with creation of a difference model
- Data preparation for subsequent REB verification
MASSEN – Volumes using Cross Sections
If the client requires documentation of volumes between boundary lines (pursuant to REB VB 21.013), the calculation areas can be compiled and defined by means of cross sections with multiple horizons. The volume calculation can be documented using a series of cross section drawings and a comprehensive report.
If the situation in the cross sections is very complex, the cross-sectional areas at the individual stations can be defined as closed polygons and processed in the volume calculation using cross sections (based on the Elling method pursuant to REB VB 21.003). Furthermore, an area calculation can also be carried out using cross sections (pursuant to REB VB 21.033).
Technical details:
- Volume between horizons, pursuant to REB VB 21.013
- Up to 99 horizons
- Positions with varying horizons
- Left/right horizons with automatic perpendiculars
- Volumes and areas from cross sections (pursuant to REB VB 21.003 and REB VB 21.033)
- Up to 99 positions (perimeters or open-ended polylines)
- Consideration of alignment curvature
- Definition of zero profiles as calculation boundaries
- Automatic interpolation of zero profiles
- Structuring of reports based on positions and stations
- Graphic verification for all cross sections, with a table listing the cross sectional areas and lengths
- Cover sheet listing all the positions
- Data preparation for subsequent REB verification
ACHSEN – Computation of Road and Railway Alignments
The geometry of profiles is always referenced to an alignment. Normally, a fully-defined alignment is provided by the client. This can be loaded and saved in various formats, and manual input is also possible.
In addition to the generation of alignments from polylines, the offsetting of points (calculation of critical points) and the calculation of points from alignment-referenced coordinates are important tools in road and tunnel construction, and also enable a stringent spatial perspective.
Technical details:
- Special railway transition curves (Schuhr, Bloss)
- Split, extend, reverse alignments
- Best fit straight line
- Best fit circle
- Tangent polygon
- Spline through specified points
- Creation of alignments from polylines
- Calculation of station points
- Setting out based on a polygon
- Creation of alignment detail points (2D+elevation and 3D)
- Diagnosis of critical points (2D+elevation and 3D)
- Intersection of an alignment with multiple alignments and polylines
- Perpendicular distances between two alignments
- Parallel alignment (pseudo-parallels)
- Transformations
- Support for DA 40, DA 21, LandXML, OKSTRA, ProVI, CARD/1, VESTRA, GND-Edit, Verm.esn, Toporail from SBB formats etc.
LQPLAN – Creation and Design of Profiles
When carrying out volume calculations from cross sections during road construction projects, there are a whole range of positions for which calculations need to be carried out, resulting from the building up of the substrate and the subgrade. The ability to edit cross section designs and constructions directly in the plan window is one of the key distinguishing features of CAPLAN.
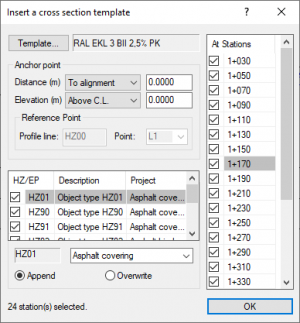
The profile structure is based on a cross-section template in which all the profile lines (horizons and Elling lines) are already predefined. Alternatively, the highway profile can be determined based on a road surface, which defines the upper surface of a road by means of lane width and crossfall values. The profile structure can then be designed and completed on this basis, with inclusion of the original terrain profile.
Technical details:
- Creation of batches of profile plans from templates
- Graphic editing of templates
- Design and construction of cross sections in the plan window
- Add point
- Add rounding curve/trench
- Free definition of reference point for design construction
- Insert new profile line / delete profile line
- Vertical shift of a profile line / cover a profile line
- Inclusion of intersection points with other profile lines
- Delete point, move point
- Creation of new profile stations
- Application of cross section templates
- Simultaneous editing of multiple profile stations
- Free definition of cross section templates and construction blocks
- Interpolation of intermediate profiles
- Exchanging of profile data with the project database
- Interpolation of profiles from points and lines
- Interpolation of individual cross sections from points (without an alignment)
- Transformation of profile points into national grid coordinates
- Support for DA 55, DA 66, LandXML, PRF river profiles, BPO ASPHALT formats etc.
- Road surface
- Deriving of lanes from polylines
- Creation from cross sections
- Setting out of a lane or all the lanes
- Verification of observed points
- Interpolation of point elevations
- Interpolation of profiles
- Support for LandXML, Wirth YXZ formats
DIRAUS – Processing of Distances and Angles
When processing and evaluating observation data, CAPLAN always takes the possibility of human error into account. This is in particular the case with regard to the processing of polar or radial (angle and distance) observations, where mistakes such as point mix-ups in the field are unfortunately not uncommon. Surveyors appreciate the automatic plausibility checks that are applied at all stages of the processing, which ensure error detection at an as early stage as possible.
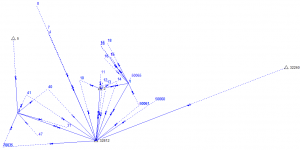
The DIRAUS module can be used to process and evaluate raw data from surveying instruments. Station checks and the subsequent foresight/backsight comparison offer a first opportunity to identify possible point mix-ups. The result of this processing is polar data that can be used for further calculations.
Technical details:
- Fieldbook documentation
- Setting out documentation
- Sequential station reduction
- Processing checks for detecting point name mix-ups
- Instrument parameters and prism data
- Hidden point rod
- Determination of refraction
- Calibration of rangefinders
- Data exchange interfaces for all instrument manufacturers
- Data preparation for the NXO-Net format (Deutsche Bahn AG)
GPUNKT – Geodetic Point Determination
In order to ensure the highest levels of accuracy, new points are calculated in two stages: The first step determines the best possible approximate coordinates, with specific algorithms negating the effects of gross errors and providing remarkably stable results. In the second stage, refined coordinates are determined by carrying out adjustments.
A powerful function in the GPUNKT module is the largely automated determination of new points in the point stack. The module also provides the full spectrum of basic surveying tasks and can solve special spatial tasks using 3D objects.
Technical details:
- Traverse calculations – plan and elevation
- Right angle traverses
- Point stack and polar points
- Single point adjustment
- Combined processing of polar observations and GNSS vectors
- Automatic assignment of observation data to control points
- Automatic detection of gross errors
- Single points (intersection, resection, two distance resection, etc.)
- Detail points and offsets from reference lines and/or polylines
- Calculation of building face points
- Reduction of observations based on the currently defined coordinate system
- Helmert transformations (2D)
- Intersection of lines and circles
- Trim and extend lines
- Connect two lines using an arc
- Define rectangle using three points
- Best fit circle (2D)
- Area calculation with reduction
- 3D objects
- Line, plane, circle, cylinder, sphere
- Adjustments using observation points
- Offsetting of points
- Calculation of detail points
- Intersection of a line with a plane
- Intersection between two planes
- Intersection of a line or a plane with a DTM
- Transformation of points on a plane
- Evenness checks pursuant to DIN 18202
NETZ1L – Plan Control Network Adjustments
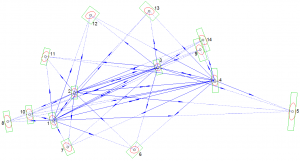
The NETZ1L module can be used to create and adjust 2D plan control networks, ranging from completely free to fully-constrained networks. In addition to the planning of networks, breakthrough accuracy prognoses can also be performed when working with tunnel networks.
Technical details:
- Creation and adjustment of any size of 2D control networks
- Free, dynamic and final network adjustment
- Prognoses for planned 2D control networks
- Interactive editing of all network data
- Distances, bearings and gyro azimuths
- Gross error detection, based on BAARDA, with automatic elimination
- Quality assessment of control point coordinates
- Internal reliability of all observations
- External reliability of the coordinates
- Determination of distance scale
- Distance analysis with relative error ellipses
- Histograms of residuals
NIVAUS – Processing of Leveling Data
When very accurate and precise elevations are required, leveling is still the first choice among the various methods of measurement that are available. The types of leveling range from the simple observation of profiles with a dumpy level to precision leveling using invar leveling staves equipped with barcodes and first order leveling methods used by national surveys.
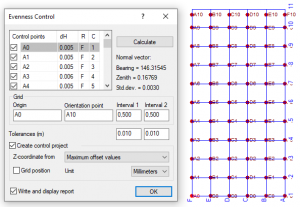
The NIVAUS module allows users to import data from all commonly-used digital instruments. When working with pre-determined control point elevations, leveling runs and loops are automatically compiled, and any closing errors are distributed. In order to provide the basis for evenness checks pursuant to the DIN 18202 standard, the leveled points can also be placed in a predefined grid.
Technical details:
- Data transfer from Leica, Sokkia, Topcon, Trimble/Zeiss digital levels
- Manual input of field book data
- Leveling staff calibration (scale, marking line corrections etc.)
- Use of various staff divisions (1/2 cm)
- Correction for expansion due to temperature
- Use of staff pairs and individual staffs
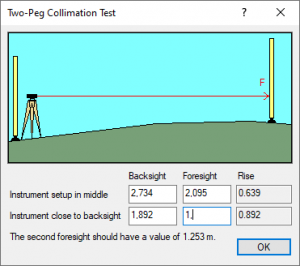
- Two-peg collimation test
- Level loop closures with estimation of accuracy
- Elevation calculations in leveling runs and loops, with adjustment
- Profile point calculations
- Grid leveling and evenness checks pursuant to DIN 18202
- Data preparation for the NXO-Net format (Deutsche Bahn AG)
NETZ1H – Level Control Network Adjustments
The NETZ1H module is recommended for elevation calculations requiring the highest possible level of reliability, as this module enables network adjustments to be carried out with a range of control point conditions (free, dynamic and final). For precision networks of the highest order, the height differences are reduced.
Technical details:
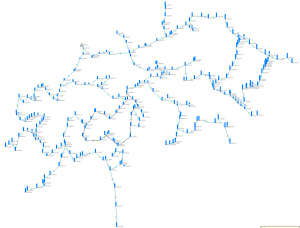
- Creation and adjustment of large leveling networks
- Normal-orthometric correction (orthometric and due to gravity)
- Free, dynamic and final adjustments
- Prognoses for planned leveling networks
- Interactive editing of all network data
- Leveled, tacheometric and other elevation differences
- Gross error detection, based on BAARDA, with automatic elimination
- Quality assessment of control point elevations
- Internal reliability of all observations
- External reliability of elevations
KOTRAN – Coordinate Transformations
As a result of the increased compatibility of all national survey organizations on the basis of the WGS / ETRS89 coordinate systems, there are numerous new tasks that can now be solved by CAPLAN with its KOTRAN module. Older coordinate systems can be converted in approximate terms to the new ETRS89 system using conformal 3D transformations. For higher accuracy requirements, local inhomogeneities must be taken into account, and these can be approximated in many cases using the NTv2 method.
Technical details:
- Numerous projections (GK, UTM, Lambert, Stereographic)
- Transformations between projection zones (zone changes)
- Datum transformations
- With global parameters (e.g. DHDN -ETRS89)
- With NTv2 grids (e.g. BeTA 2007, LET Hessen, etc.)
- With DLL (e.g. Schleswig-Holstein, North Rhine-Westphalia)
- Prepared for all common NTv2 grids
- Integration of user NTv2 grids
- Import and export of WGS (X,Y,Z or latitude/longitude)
- User-defined formats for geocentric and geographic coordinates
- Transformation of
- CAPLAN projects
- 2D plans in the plan window
- Point files (individual / batch)
- DXF files (individual / batch)
- Meridian convergence and UTM grids
- Calculation of datum parameters from identical points
- Various geoid models (WGS, EGG97, GCG2016 etc.)
- Control point transformations (Helmert, affine, 3D etc.)
- Distribution of residuals
- Automatic assignment of control points
- Parameter transformations without control points
- Importing of processed GNSS baselines from all instruments
- GNSS baseline closure checks
- Offset corrections for GNSS baselines
- Calculation of provisional national grid coordinates
- Recognition of false point names
NETZ1R – 3D Networks Adjustments
GNSS technology shows its strength in particular with regard to primary networks: it offers homogeneous and high accuracy over the entire project area with relatively low measurement effort. Here, economy and precision meet in perfect harmony.
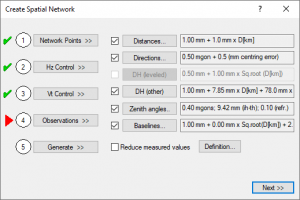
The NETZ1R module extends the options available for performing horizontal and vertical adjustments. With the combined spatial adjustment, it is possible to combine already processed GNSS baselines with classical terrestrial observations (such as total station surveys and leveling). These can be integrated using weighting based on their respective accuracies, in order to create a single hybrid spatial network.
Technical details:
- Combined adjustment of terrestrial survey measurements and GNSS baselines in a national coordinate system
- Free, dynamic and final adjustments
- Prognoses for planned spatial networks
- Distances, bearings and gyro azimuths
- Level differences, zenith angles and slope distances
- GNSS baselines
- Gross error detection, based on BAARDA, with automatic elimination
- Quality assessment of control point coordinates
- Internal reliability of all observations
- External reliability of the coordinates
- Distance analysis
- Histograms of residuals
NETZ2X – Deformation Analysis
Horizontal and vertical control surveys of building structures usually consist of an initial survey followed by subsequent surveys carried out at regular time intervals, to monitor possible deformation. Regardless of whether the control survey is done on a primary network, a building or a dam, the objects being monitored should always be defined using a sufficient number of suitably enduring object points, the position of which can be checked against stable reference points.
Many documentation procedures are based on a direct comparison of coordinates. A prerequisite in this regard is that the stability of the reference points is ensured and that a sufficiently accurate determination of the coordinates is performed in every epoch. This comparison of epochs is available in the basic CAPLAN module.
The actual deformation analysis, based on the Pelzer method, is available in the NETZ2X module and goes a crucial step further, as it can be used to compare two already adjusted networks. For this, all the points are designated as either reference points or object points, with the reference points being assumed to be stable. The analysis includes the checking of reference points with regard to stability and, if necessary, the redesignation of any unstable reference points as object points.
Technical details:
- Extended functionality for any other modules in use that are related to adjustments
- Comparison of two adjusted networks
- Subdivision into reference and object points
- Analysis of the reference points with regard to stability
- Calculation of significant deformations
- Comprehensive documentation of the calculation
- Visualization of significant deformations
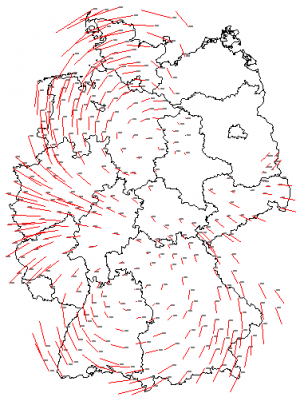
- Vector plans (e.g. horizontal positional changes)
- Section plans with vectors and terrain (e.g. for landslides)
- Distance-distance-diagrams (e.g. profile movements)
- Time-distance-diagrams (e.g. for settlement/subsidence measurements
News
- April 15, 2024 - New videos on YouTube
Our YouTube channel offers various new videos describing the themes from "News from CAPLAN 2024". All these ... - July, 28 2023 - Intergeo
Intergeo 2023 in Berlin from Oct. 10th to Oct. 12th We will be pleased to welcome ... - May, 30 2023 - CAPLAN-Update distributed
The CAPLAN update to version 5.7 has been distributed. If you, as a customer with a valid maintenance ...
